
The release of the new APS CALD employment strategy has highlighted that while the public service has become more diverse, there is a long way to go in making sure APS leadership looks like the wider population.
While the strategy focuses on getting more CALD workers into SES roles, there are large gaps between the absolute numbers of employees by department and agency.
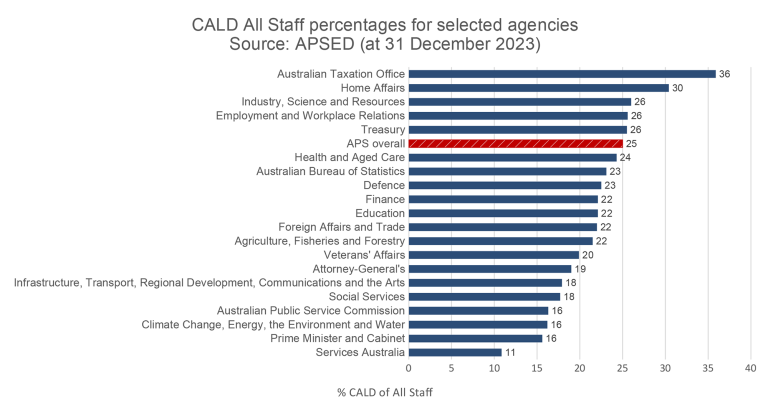
The number of Indigenous and non-English speaking workers ranges from 7-25%.
In Veterans Affairs, 7% of the workforce was from Indigenous and non-English speaking backgrounds in December 2023 — the lowest-performing agency on this metric. The best-performing in the same measurement period was Home Affairs, at 25%, closely followed by Treasury, at 24%
Among agencies and government corporations with more than 100 employees, Aboriginal Hostels Limited ranked as the most diverse, with 69% of its workforce from Indigenous and non-English speaking backgrounds. Sport Integrity Australia ranked lowest, at 3%.
CALD status has traditionally been measured based on an employee’s first language spoken, country of birth, year of arrival in Australia for those born overseas, father’s first language spoken, and mother’s first language spoken, collated into a metric called Non-English Speaking Background (NESB).
The revised numbers in the plan show about 25% of the APS come from culturally and linguistically diverse (CALD) backgrounds — a similar portion to the overall population — but remain underrepresented in positions of decision-making authority.
CALD employees account for more than 30% of compliance, regulation, accounting and finance staff, and almost 40% of ICT staff.
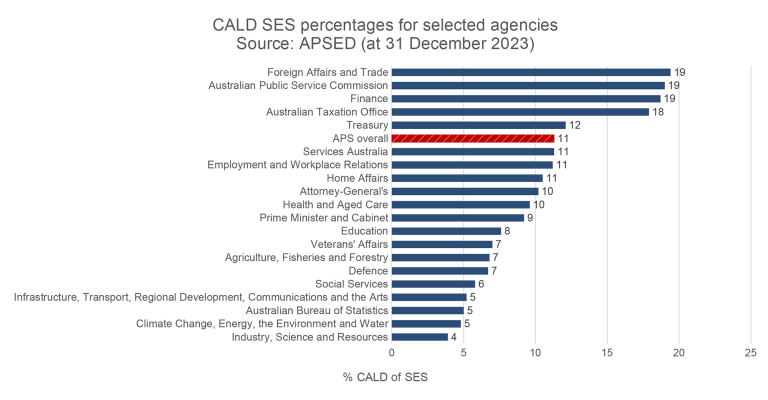
In comparison, CALD staff account for 11% of senior executives, 20% of the policy job family and 17% of the communications and marketing workers.
Performing best in the SES representation stakes, Foreign Affairs and Trade, the APSC, and Finance all have 19% CALD representation. Industry Science and Resources was the worst-performing department, with CALD representation of 4% at the SES level.
But they were just one of many departments that fell well below the plan’s intended target of 15% within four years.
While the increased overall numbers in APSC’s new methodology may raise eyebrows, a spokesperson said this brought public service data into line with the Australian Bureau of Statistics.
“Given the limitations that exist when measuring other relevant markers of CALD identity, this strategy uses an APS employee’s first language spoken to compare to the ABS census measure of language spoken at home,” they said.
“This allows for comparisons to the broader community. More details can be found within the refined quantitive data approach, starting on page 15.
“Drawing on HR data and employee perception data provides the best possible approach in using existing sources. We will monitor and review what data is collected and used in the context of supporting the plan.
“We will also continue to use other data metrics, where appropriate, to illustrate different dimensions of the CALD experience.”
READ MORE:

